Disk I/O Utilization - sda
The statistics were last updated Sunday, 4 October 2026 at 22:55
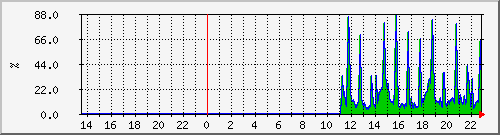
`Daily' Graph (5 Minute Average)
|
Max |
Average |
Current |
| I/O Utilization: |
87.0 % |
20.0 % |
8.0 % |
| I/O Utilization: |
87.0 % |
20.0 % |
8.0 % |
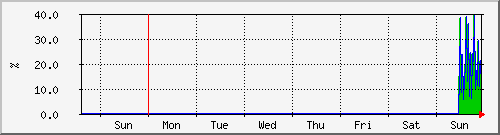
`Weekly' Graph (30 Minute Average)
|
Max |
Average |
Current |
| I/O Utilization: |
39.0 % |
19.0 % |
12.0 % |
| I/O Utilization: |
39.0 % |
19.0 % |
12.0 % |
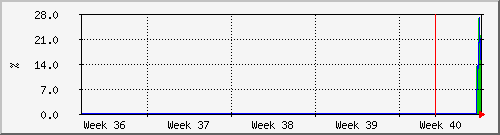
`Monthly' Graph (2 Hour Average)
|
Max |
Average |
Current |
| I/O Utilization: |
26.0 % |
18.0 % |
22.0 % |
| I/O Utilization: |
26.0 % |
18.0 % |
22.0 % |
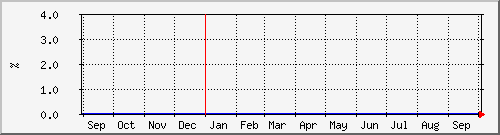
`Yearly' Graph (1 Day Average)
|
Max |
Average |
Current |
| I/O Utilization: |
0.0 % |
0.0 % |
0.0 % |
| I/O Utilization: |
0.0 % |
0.0 % |
0.0 % |
| GREEN ### |
I/O Utilization |
| BLUE ### |
I/O Utilization |